Chapter 3 Programming Challenges I: Learning the fundamentals
What is the purpose of these problems, and why should you try to solve them? An important overarching goal in learning to code is to become justifiably confident in your ability to write scripts to solve problems. At the end of the day you will be applying your skills to new problems without textbook answers, and your ability to solve these problems rests in learning how to write new code that works. This is not an abstract problem, and instead requires practice with writing code to solve new problems. The following problem sets are designed primarily with this aim in mind. Solving these problems will simultaneously develop your ability to write scripts to solve new problems, as well as give you hands on exposure to learning the syntax of the R language. These problems are not written specifically for the R language, and the solving the same problems in another language is a useful strategy for learning the syntax of another language.
The problems are roughly ordered in terms of difficulty, with easier problems first and harder problems second. All of the problems can be solve by combining the foundational programming concepts already discussed. That is, they can be solved by declaring variables, using logic statements, and for loops to create algorithms that solve each problem. Some of the problems require writing functions, which is a more formal and general way of writing algorithms. Many of the problems can be solved very quickly and efficiently by writing only a few lines of code, and by using intrinsic functions already supplied by the R programming language. For each of the problems you might consider writing different solutions to explore different syntax options.
3.1 Tips for Approaching the Problems
Before you begin solving each of the problems it is worth considering how you will organize your solutions. This is important, as the code that you write now may become useful as a reference later, and to use the reference you will want to be able to find your code quickly and easily in the future. An example of bad practice here is to save your solutions to your desktop or other random folder on your computer. Instead, create a programming folder (or something similar), and organize your progress by saving informatively named files to appropriately named subfolders.
3.1.1 Rstudio’s Text editor
You should be making use of R studio’s text editor to complete the problem sets. It is important to establish good coding practices from the very beginning. Make sure that your code is easy to read. This will help you understand your own code later, and help other people understand your code when sharing it or when asking for help.
3.1.2 Use informative variable names.
You will be declaring many different kinds of variables. R usually will not care what name you give to any variable. Oftentimes scripts can be written very quickly when variables are declared with names like a, b, i, or x (which are common variable names in algebra). These kinds of variable names are not very informative, and it is preferable to give names that represent the meaning of the data stored in each variable.
3.1.3 Use comments.
You can insert comments into your scripts. In R, all text following the number sign # will turn to green (become commented out), and will not be compiled by R when the code is run. Comments are useful for explaining to yourself and to others what various parts of the script are accomplishing (or attempting to accomplish). Clear and easy follow code generally contains useful (and non-redundant comments).
3.1.4 R Markdown.
R studio’s text editor allows for the creation of markdown files. Markdown is a very simple short-form language for creating HTML documents that can be viewed in a web-browser, or printed as a .pdf. This is an extremely powerful tool because it combines the power of a simple word-processor, with the power of R. In practice, this means that you can write documents with titles, headings, paragraphs, and sentences, and include in these documents the R-scripts that you are writing, and the output of these scripts. Thinking ahead, when you are using R to transform and analyse your own data, it is possible to create a data-journal to combine all of your efforts into one document. For example, a data-journal could include notes on the design of the experiment, links to the data, notes about pre-processing considerations, code use to pre-process the data, notes on statistical tests, code to run them along with the output from the tests, thoughts on how to present the data along with journal-quality figures formatted to specific sizes, and so on.
To make use of Markdown, it is recommended that you create a single markdown document, that will list each of the problems and your solutions.
3.2 Use Hypothesis to annotate your solutions
Hypothesis is a web-browser add-on tool for annotating web-pages. It’s free, open-source, and to get started all you need to do is go to the website, sign-up, and install the add-on for chrome, or follow the instructions to use a bookmarklet for other browsers. Then, for any webpage including this one, you can post public comments (annotations) by selecting text on the page, and clicking the annotate button that pops up. I will be posting sample code for each of the problems using hypothesis, and the answers will only be viewable if you have that working. Please feel free to contribute your own answers by posting code for each of the problems. Repositories of working code are an invaluable resource when learning to code, and perhaps some good examples can be provided here by anyone interested in participating.
3.3 Easier Problems
- Do simple math with numbers, addition, subtraction, multiplication, division
- Put numbers into variables, do simple math on the variables
- Write code that will place the numbers 1 to 100 separately into a variable using for loop. Then, again using the seq function.
- Find the sum of all the integer numbers from 1 to 100.
- you can use the
sum()function on a vector of numbers - How would you do this without using the sum function? For example, how could you use a for loop to accomplish this task?
- Write a function to find the sum of all integers between any two values.
# syntax for writing a function

function_name <- function(input_name){
  #body where you modify input
  return(name_of_output)
}

# running the function
function_name(some_input)- List all of the odd numbers from 1 to 100.
- you could use the
seq()function - How could you do this without using the
seq()function? Consider using the mod function%%, which evaluates whether or not there is a remainder when dividing one number by another.
# four divided by two gives no remainder
# the mod function shows 0
4%%2
## [1] 0# 5 divided by two gives a remainder
# the mod function shows 1
5%%2## [1] 1- List all of the prime numbers from 1 to 1000.
- Generate 100 random numbers
- check out the
runiffunction - to look at the help file run
?runifin the console. In general?function_namewill show the help file for any function in R.
- Generate 100 random numbers within a specific range
runifcan do this
- Write your own functions to give descriptive statistics for a vector variable storing multiple numbers. Write functions for the following without using R intrinsics: mean, mode, median, range, standard deviation
- It’s ok to use
sum()andlength() - be creative and see if you can find multiple solutions. Here is an example for two ways to compute the mean.
# using sum and length
mean_A <- function(x){
  return(sum(x)/length(x))
}

some_numbers <- c(1,2,3,4,5)
mean_A(some_numbers)
## [1] 3# no intrinsics
mean_B <- function(x){
counter <- 0
total_sum <-0
for(i in x){
total_sum <- total_sum+i
counter<-counter+1
}
return(total_sum/counter)
}
mean_B(some_numbers)## [1] 3- Count the number of characters in a string variable
- use
strsplit()to split a character vector
a <- "adskfjhkadsjfh"
strsplit(a,split="")
## [[1]]
## [1] "a" "d" "s" "k" "f" "j" "h" "k" "a" "d" "s" "j" "f" "h"# note that strsplit returns it's result in a list
b <-strsplit(a,split="")
b[[1]] # access all elements in list 1## [1] "a" "d" "s" "k" "f" "j" "h" "k" "a" "d" "s" "j" "f" "h"b[[1]][1] # access first element of list 1## [1] "a"# lists can be unlisted
d <- unlist(strsplit(a,split=""))
d # all elements in character vector## [1] "a" "d" "s" "k" "f" "j" "h" "k" "a" "d" "s" "j" "f" "h"d[1] #first element## [1] "a"- Count the number of words in a string variable
- use
strsplit
a <- "this is a sentence"
strsplit(a,split=" ") # use a space as the splitting character
## [[1]]
## [1] "this" "is" "a" "sentence"- Count the number of sentences in a string variable
- consider splitting by the
.character
- Count the number of times a specific character occurs in a string variable
table()function can help count individual occurences
a <- c(1,3,2,3,2,3,2,3,4,5,4,3,4,3,4,5,6,7)
table(a)
## a
## 1 2 3 4 5 6 7
## 1 3 6 4 2 1 1- How would you do this without the table function?
- Do a logical test to see if one word is found within the text of another string variable.
- For example given the word hello, can you run a test to see if it is contained in the test sentence?
test_word <- "hello"
test_sentence <-"is the word hello in this sentence"- consider using
%in%
a <- c(1,2,3,4,5)
b <- 5
d <- 8

# question is b in a?
b%in%a
## [1] TRUE# is d in a?
d%in%a## [1] FALSE- Put the current computer time in milliseconds into a variable
print(as.numeric(Sys.time())*1000, digits=15)## [1] 1548859557051.05Measure how long a piece of code takes to run by measuring the time before the code is run, and after the code is run, and taking the difference to find the total time
- Read a .txt file or .csv file into a variable
scan()is a general purpose text input functionread.csv()will read .csv files
- Output the contents of a variable to a .txt file
write.csv()
- Create a variable that stores a 20x20 matrix of random numbers
- here’s how you make a matrix full of 0s
a <- matrix(0, ncol=20,nrow=20)- Output any matrix to a txt file using commas or tabs to separate column values, and new lines to separate row values
write.csv()
3.4 Harder Problems
- The FizzBuzz Problem. List the numbers from 1 to 100 with the following constraints. If the number can be divided by three evenly, then print Fizz instead of the number. If the number can be divided by five evenly, then print Buzz instead of the number. Finally, if the number can be divided by three and five evenly, then print FizzBuzz instead of the number. The answer could look something like this:
1, 2, Fizz, 4, Buzz, Fizz, 7, 8, Fizz, Buzz, 11, Fizz, 13, 14, FizzBuzz, 16, 17, Fizz, 19, Buzz, Fizz, 22, 23, Fizz, Buzz, 26, Fizz, 28, 29, FizzBuzz, 31, 32, Fizz, 34, Buzz, Fizz, 37, 38, Fizz, Buzz, 41, Fizz, 43, 44, FizzBuzz, 46, 47, Fizz, 49, Buzz, Fizz, 52, 53, Fizz, Buzz, 56, Fizz, 58, 59, FizzBuzz, 61, 62, Fizz, 64, Buzz, Fizz, 67, 68, Fizz, Buzz, 71, Fizz, 73, 74, FizzBuzz, 76, 77, Fizz, 79, Buzz, Fizz, 82, 83, Fizz, Buzz, 86, Fizz, 88, 89, FizzBuzz, 91, 92, Fizz, 94, Buzz, Fizz, 97, 98, Fizz, Buzz
- Here a few bits that might be useful
# a number mod three will return 0 if it divides evenly
6%%3
## [1] 0# a number mod five will return 0 if it divides evenly
10%%5## [1] 0# examples of replacing elements of a vector
a<-c(1,2,3,4,5)
a[3]<-"Fizz"
a## [1] "1" "2" "Fizz" "4" "5"# notice that a starts as a numeric vector
# but changes to an all character vector after "Fizz" is added- Frequency Counts Take text as input, and be able to produce a table that shows the counts for each character in the text. This problem is related to the earlier easy problem asking you to count the number of times that a single letter appears in a text. The slightly harder problem is the more general version: count the frequencies of all unique characters in a text.
- here’s the easy way to do this
a<-"some text that has some letters"
table(unlist(strsplit(a,split="")))
##
## a e h l m o r s t x
## 5 2 5 2 1 2 2 1 4 6 1- Can you do this without using table? Attempt this problem using
data.frame. Here are some more tips
# data.frame is data format that produces named columns of data

# creates two vectors
numbers <-c(1,2,3,4,5)
letters <-c("a","b","c","d","e")

# make a data.frame from two vectors
new_df <- data.frame(numbers,letters)
print(new_df)
## numbers letters
## 1 1 a
## 2 2 b
## 3 3 c
## 4 4 d
## 5 5 e# access individual columns of dataframe
new_df$numbers## [1] 1 2 3 4 5new_df$letters## [1] a b c d e
## Levels: a b c d e# get names of data.frame
names(new_df)## [1] "numbers" "letters"# break the problem into steps
# first part of problem is to identify all unique character in the string
a<-c(1,2,3,4,5,2,2,3,2,3)
unique(a)## [1] 1 2 3 4 5b<-"a string with some letters"
unique(unlist(strsplit(b,split="")))## [1] "a" " " "s" "t" "r" "i" "n" "g" "w" "h" "o" "m" "e" "l"# second part is to go through each of the unique letters in the list of unique letters, and for each count the number of times they appear in the original text
# store the results in a data.frame with two columns, one with the letter names, and another with the counts- Test the Random Number Generator Test the random number generator for a flat distribution. Generate a few million random numbers between 0 and 100. Count the number of 0s, 1s, 2s, 3s, etc. all the way up to 100. Look at the counts for each of the numbers and determine if they are relatively equal. For example, you could plot the counts in Excel to make a histogram. If all of the bars are close to being flat, then each number had an equal chance of being selected, and the random number generator is working without bias.
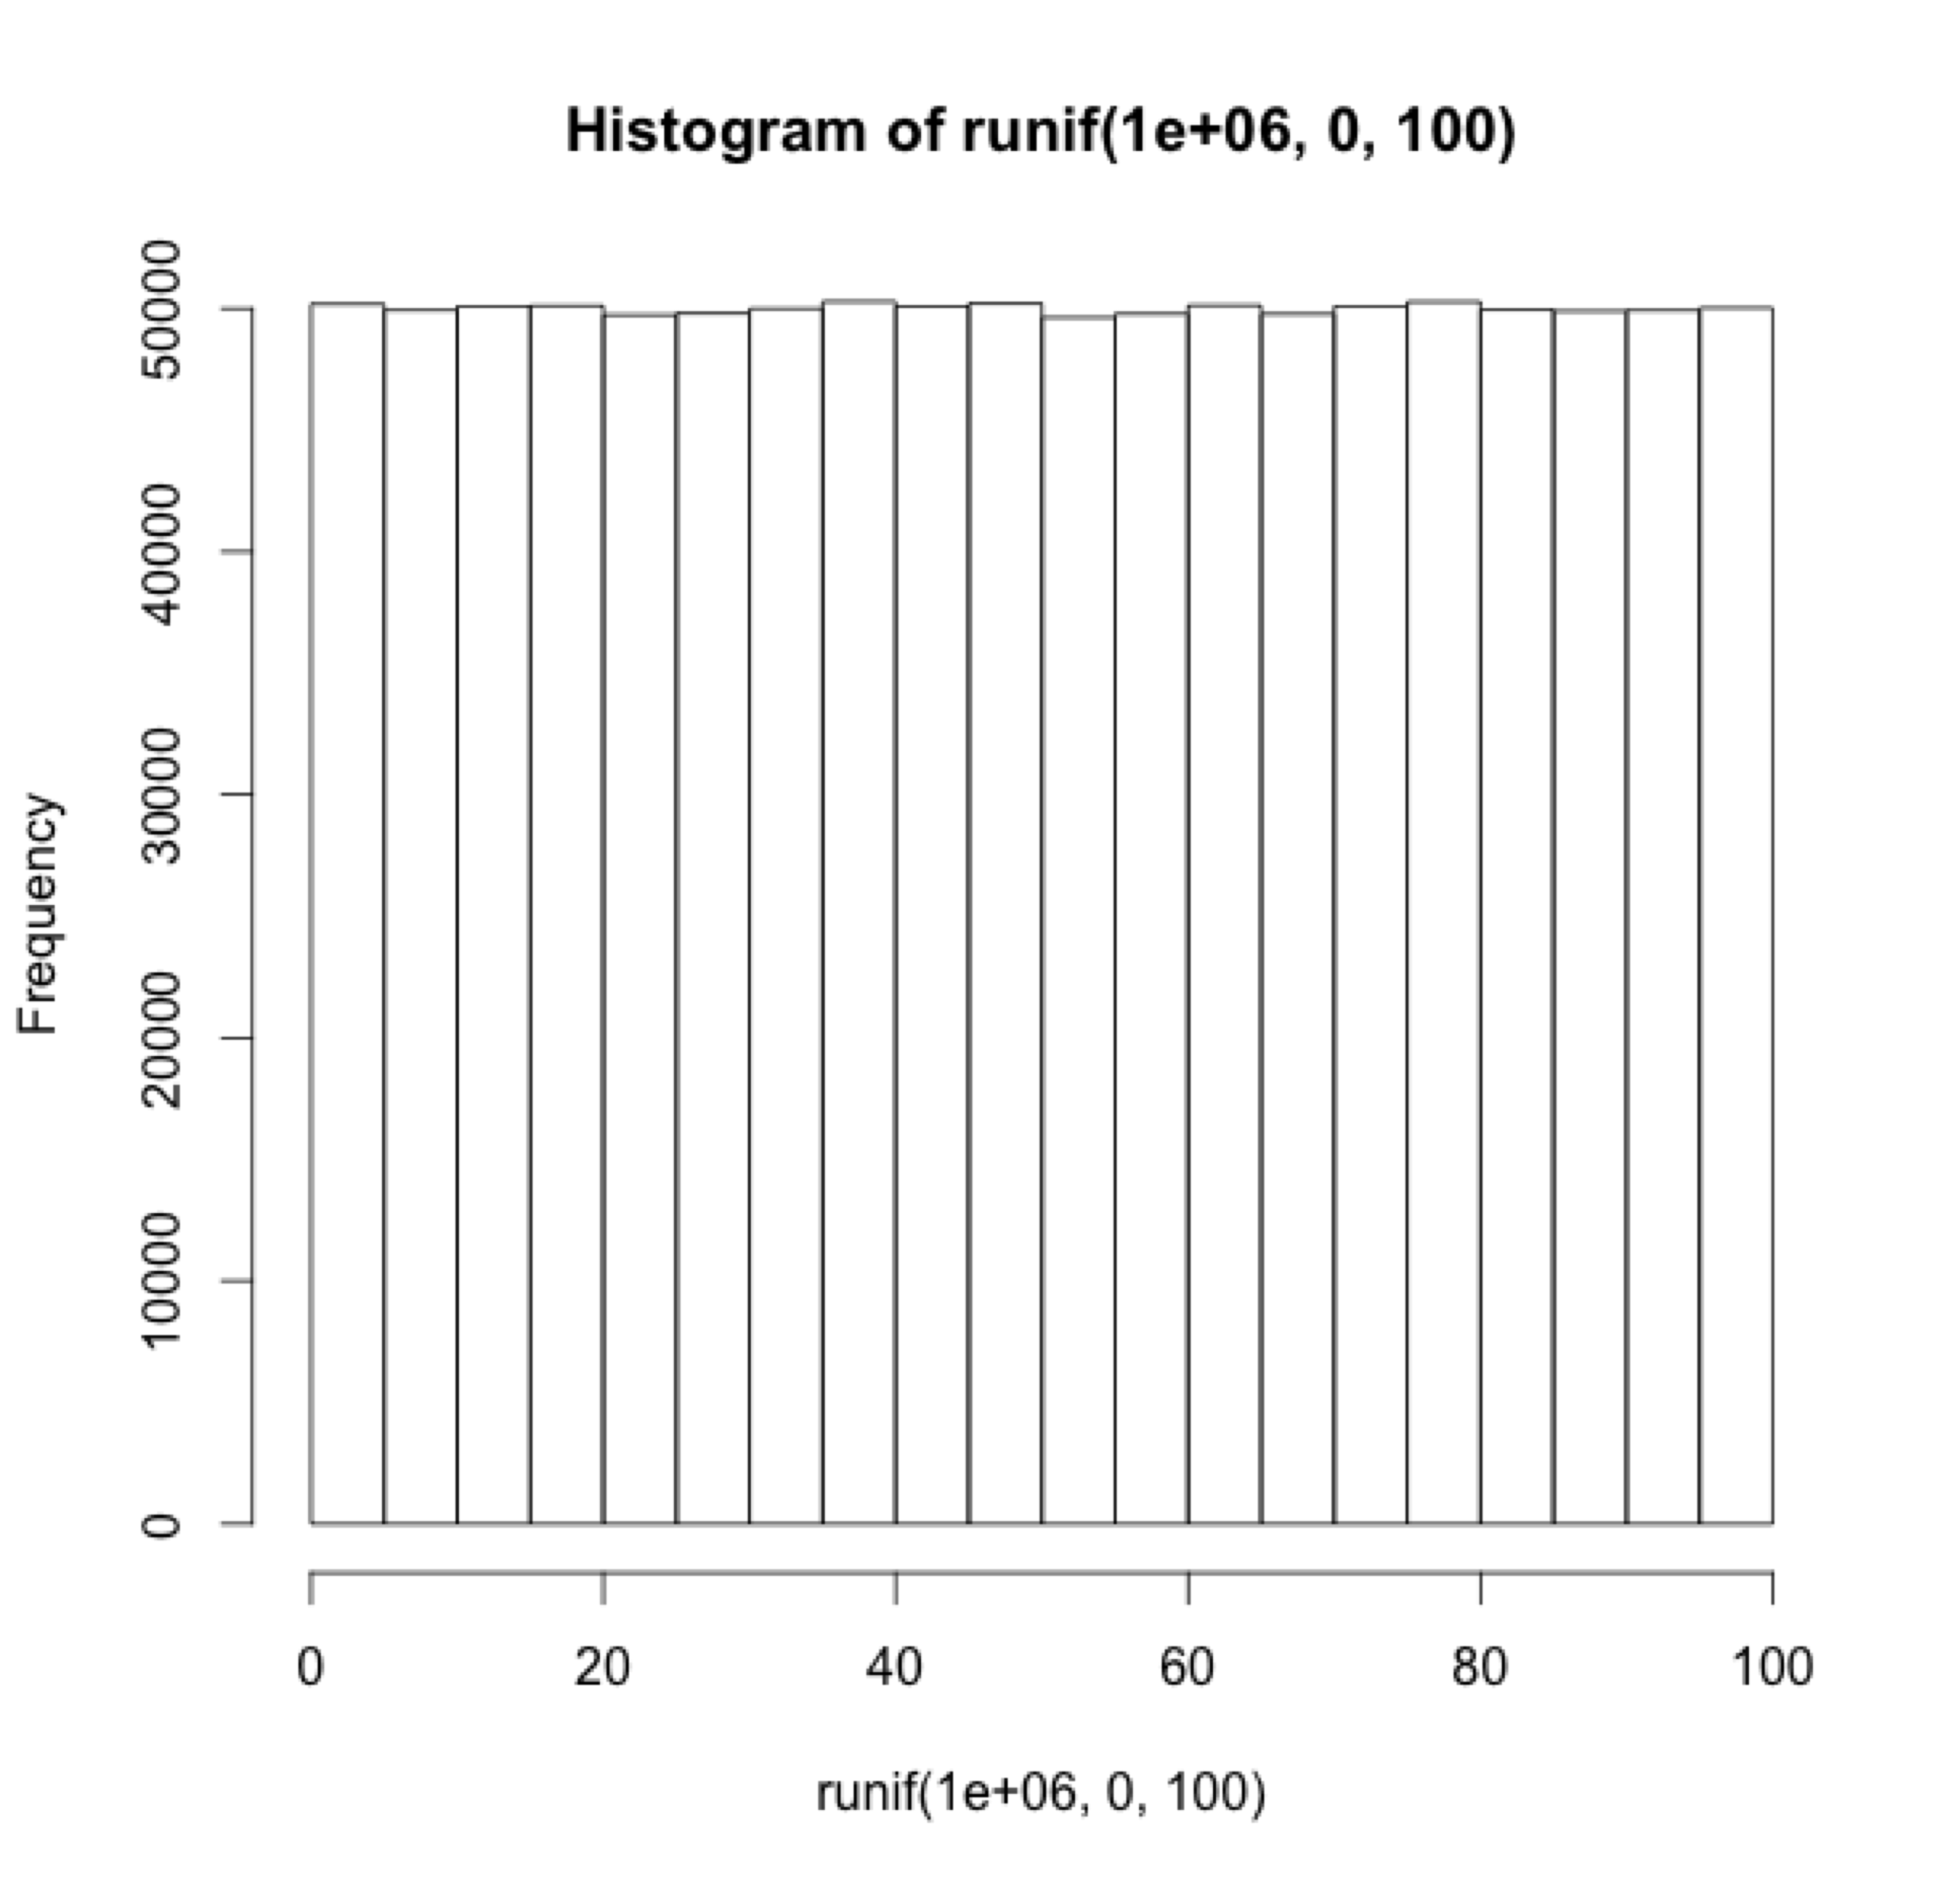
Figure 3.1: Histogram showing sampled data from a uniform distribution
a<-runif(100,0,100)
hist(a)- Create a multiplication table Generate a matrix for a multiplication table. For example, the labels for the columns could be the numbers 1 to 10, and the labels for the rows could be the numbers 1 to 10. The contents of each of the cells in the matrix should be correct answer for multiplying the column value by the row value.
# you can multiply all numbers in a vector in one go
a<-c(1,2,3,4,5,6,7,8,9,10)
a*2
## [1] 2 4 6 8 10 12 14 16 18 20# you can nest loops
for(i in 1:3){
for(j in 1:3){
print(i*j)
}
}## [1] 1
## [1] 2
## [1] 3
## [1] 2
## [1] 4
## [1] 6
## [1] 3
## [1] 6
## [1] 9- Encrypt and Decrypt the Alphabet Turn any normal english text into an encrypted version of the text, and be able to turn any decrypted text back into normal english text. A simple encryption would be to scramble the alphabet such that each letter corresponds to a new randomly chosen (but unique) letter.
- The following code shows an example using numbers
original_sequence <- c(1,2,3,4,5,2,2,3,2,4,5,2)
numbers <- unique(original_sequence)
scrambled_numbers <- sample(numbers)
encryption_key <- data.frame(numbers,scrambled_numbers)

encrypt_numbers <-function(input_sequence,key){
  encrypted_sequence<-c()
  for(i in 1:length(input_sequence)){
    original_number <- input_sequence[i]
    new_number <- key[key$numbers==original_number,]$scrambled_numbers
    encrypted_sequence[i] <- new_number
  }
  return(encrypted_sequence)
}

encrypt_numbers(original_sequence,encryption_key)
## [1] 5 1 2 3 4 1 1 2 1 3 4 1- here is a different approach making use of the
factor()function
original_sequence <- c(1,2,3,4,5,2,2,3,2,4,5,2)
original_sequence <- as.factor(original_sequence)
levels(original_sequence) # show names of levels in factor
## [1] "1" "2" "3" "4" "5"new_sequence <- original_sequence # copy
levels(new_sequence)<-c(5,4,3,2,1) # rename the levels
new_sequence # all elements are now changed## [1] 5 4 3 2 1 4 4 3 4 2 1 4
## Levels: 5 4 3 2 1- Snakes and Ladders
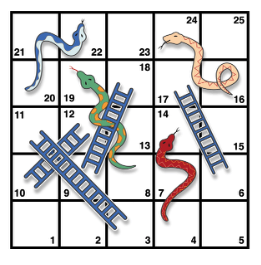
Your task here is to write an algorithm that can simulate playing the above depicted Snakes and Ladders board. You should assume that each roll of the dice produces a random number between 1 and 6. After you are able to simulate one played game, you will then write a loop to simulate 1000 games, and estimate the average number of dice rolls needed to successfully complete the game.
# rolling a dice with sample
sample(c(1,2,3,4,5,6),1)
## [1] 3sample(c(1,2,3,4,5,6),1)## [1] 4sample(c(1,2,3,4,5,6),1)## [1] 1-tip: consider a simpler version of the problem. How many times do you need to roll a dice so that all of the dice rolls add up to 25 or greater?
# try one simulation
total_sum<-0
number_of_rolls<-0
while(total_sum < 25){
  number_of_rolls <- number_of_rolls+1
  total_sum <-total_sum+sample(c(1,2,3,4,5,6),1)
}
number_of_rolls
## [1] 8# record the results from multiple simulations
save_rolls <- c()
for(sims in 1:100){
total_sum<-0
number_of_rolls<-0
while(total_sum < 25){
number_of_rolls <- number_of_rolls+1
total_sum <-total_sum+sample(c(1,2,3,4,5,6),1)
}
save_rolls[sims] <- number_of_rolls
}
mean(save_rolls)## [1] 7.58- how do you add in a representaion of the board, so that you change which square the player is on depending on whether they land on a ladder or snake.
Dice-rolling simulations. Assume that a pair of dice are rolled. Using monte carlo-simulation, compute the probabilities of rolling a 2, 3, 4, 5, 6, 7, 8, 9, 10, 11, and 12, respectively.
Monte Hall problem. The monte-hall problem is as follows. A contestant in a game show is presented with three closed doors. They are told that a prize is behind one door, and two goats are behind the other two doors. They are asked to choose which door contains the prize. After making their choice the game show host opens one of the remaining two doors (not chosen by the contestant), and reveals a goat. There are now two door remaining. The contestant is asked if they would like to switch their choice to the other door, or keep their initial choice. The correct answer is that the participant should switch their initial choice, and choose the other door. This will increase their odds of winning. Demonstrate by monte-carlo simulation that the odds of winning is higher if the participant switches than if the participants keeps their original choice.
100 doors problem. Problem: You have 100 doors in a row that are all initially closed. You make 100 passes by the doors. The first time through, you visit every door and toggle the door (if the door is closed, you open it; if it is open, you close it). The second time you only visit every 2nd door (door 2, 4, 6, etc.). The third time, every 3rd door (door 3, 6, 9, etc.), etc, until you only visit the 100th door.
Question: What state are the doors in after the last pass? Which are open, which are closed?
- 99 Bottles of Beer Problem In this puzzle, write code to print out the entire “99 bottles of beer on the wall”" song. For those who do not know the song, the lyrics follow this form:
X bottles of beer on the wall X bottles of beer Take one down, pass it around X-1 bottles of beer on the wall
Where X and X-1 are replaced by numbers of course, from 99 all the way down to 0.
- Random Tic-Tac-Toe Imagine that two players make completely random choices when playing tic-tac-toe. Each game will either end in a draw or one of the two players will win. Create a monte-carlo simulation of this “random” version of tic-tac-toe. Out 10,000 simulations, what proportion of the time is the game won versus drawn?