The plug-in window
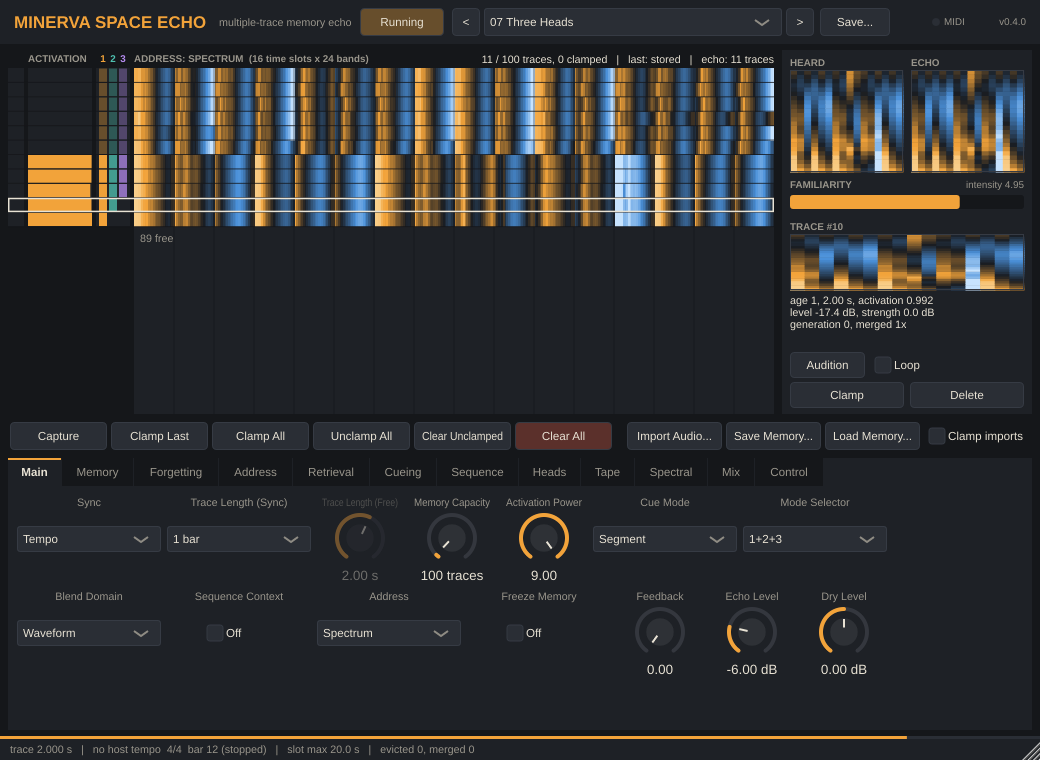
The window has five areas: the header, the memory matrix, the side panel, the memory buttons, and the parameter pages, with a status bar along the bottom. It can be resized from the bottom-right corner.
Header
Running / Paused: pausing leaves memory exactly as it is (nothing is stored, forgotten or cued), fades the echo out and passes the dry signal; everything else (inspecting, auditioning, clamping, importing, saving) still works. Resuming starts cleanly at the next segment. It is also a parameter, so you can MIDI-map or automate it.
The preset menu with < and > to step through presets, and Save… to save your own (Presets). On the right, the MIDI light flashes when a note arrives, and the version number.
Memory matrix
One row per stored trace, oldest at the top. From left to right:
| Column | Shows |
|---|---|
| Lock | An amber lock if the trace is clamped. Click here to clamp or unclamp it. |
| Activation | How strongly the trace answered the last cue: amber for positive, blue for negative, scaled to the strongest. |
| Heads 1 2 3 | Which playback heads are playing the trace right now (1 amber, 2 teal, 3 violet); brighter = louder. |
| Address | The trace’s address exactly as MINERVA stores it, in the address set being compared (the caption names it; with a Custom mix, the most weighted set). For the Spectrum: 16 time slots, left to right, each a 24-band spectrum from low to high; amber is above the trace’s average level, blue below. The other sets are laid out the same way, time left to right (Addresses). |
With Sequence Context on, each address is shown as [n−1 | n]: the previous segment’s address, a divider, then the trace’s own (Sequences).
Rows are tall while memory is nearly empty and shrink as it fills, so the view always fits; the space below the last row stands for free slots. With more traces than pixels (grain memories), each pixel row shows the strongest of the traces it covers.
Hover over a row for its details. Click a row to inspect it in the side panel; click again to deselect. Alt-click a row to listen to it (again to stop); the row being auditioned is outlined in teal.
The line above the matrix gives memory’s fill (traces / capacity), how many are clamped, what happened to the last segment (stored, merged, gated, rejected (full), frozen) and how many traces the current echo uses.
Repeated material shows up as rows with similar stripes. When you play something familiar, the activation bars light up on the rows that resemble it; with Activation Power high, only one or two light up; with it low, many do.
Side panel
- Heard: the address of the last segment you played, which is what cued memory. Time runs left to right, low bands at the bottom.
- With Sequence Context on, Heard shows the last two segments [n−1 | n] and Echo shows the echo’s context half and its n half, labelled “expected next” in Predict Next and Echo Chain.
- Echo: the echo’s content, the activation-weighted blend of the answering traces’ addresses (MINERVA’s echo). Compare it with Heard to see how memory reinterpreted what you played.
- Familiarity: the strongest activation, as a bar, and MINERVA’s intensity (the sum of activations).
- Selected trace: its address, age (traces stored since), length, level, strength, generation (0 = heard, 1+ = an echo that was recorded) and how many segments were merged into it, with Clamp/Unclamp and Delete buttons.
- Audition plays the selected trace on its own: the plug-in’s output is muted while it plays (running or paused), and returns afterwards. Loop repeats it until you press Stop. With Sequence Context on, n−1 | n plays the segment before it (if that is still in memory) and then the trace. Auditions are never recorded.
Probing memory
A sanity check for the model: use a trace’s address as a cue and see, and hear, which traces it activates. Select a trace and press Probe (or Shift-click its row; again to end). It works running or paused, and never changes memory, the random streams or what the plug-in plays.
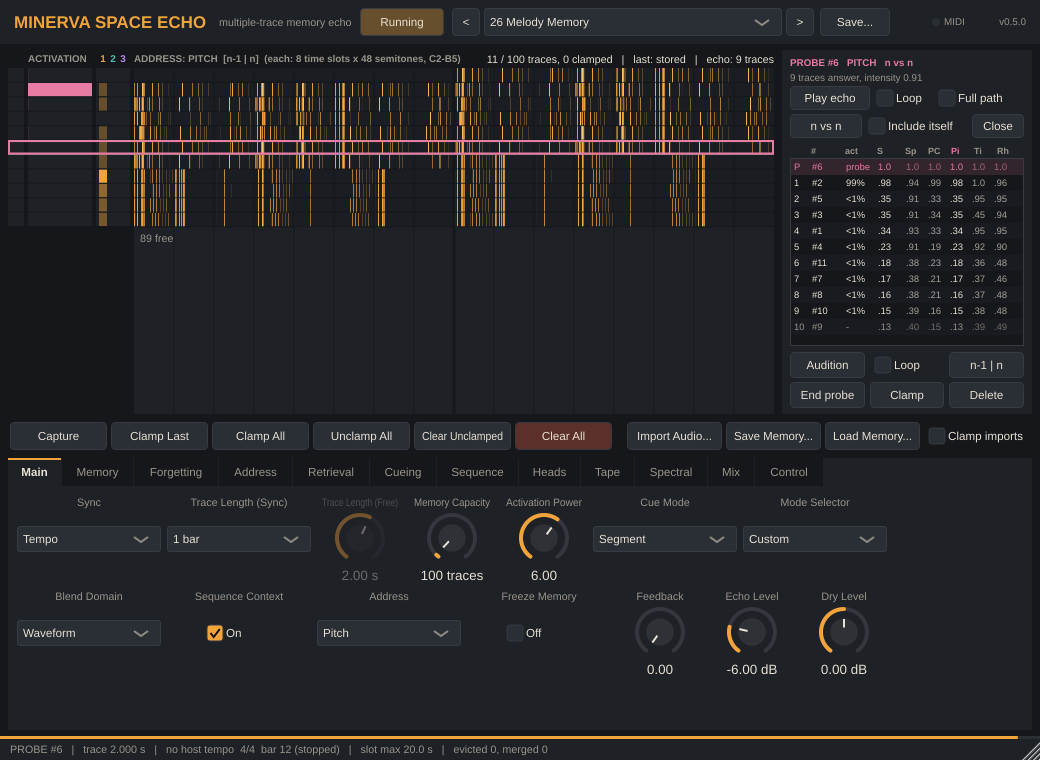
- The activation bars in the matrix show the probe’s activations, in magenta, and the probe row is outlined.
- The side panel lists every trace, ranked by how strongly it answers: its share of the total activation (act), its similarity under the current Address (S) and under each address set (Sp Spectrum, PC Pitch Class, Pi Pitch, Ti Timbre, Rh Rhythm; the set in use is highlighted). The probe itself is pinned at the top (P). Click a row to listen to that trace; click again to stop.
- Play echo plays the echo this probe produces, soloed, once or with Loop. Unticked, Full path plays the raw blend: the traces’ audio mixed by their activations. Ticked, the blend goes through the echo’s tone, tape (wow, flutter, drive, hiss), head 1 and echo level, and spring, as the plug-in would sound (without heads 2 and 3 or feedback).
- n vs n compares the probe with each trace’s own address (recall); n vs n−1 (with Sequence Context on) with each trace’s context half, so the list is what memory expects to come next.
- Include itself lets the probe trace answer too (it always matches itself at 1).
Everything updates as you change the Address, Activation Power, Similarity and the other retrieval settings, even while the echo loops, so you can hear what each encoding treats as similar. The probe uses the retrieval settings except cue noise and habituation, so it describes memory itself.
Parameter pages
Main gathers the essentials; the other pages hold everything else: Memory, Forgetting, Address (which address memory compares, and the Custom weights), Retrieval, Cueing, Heads, Tape, Spectral, Mix and Control (MIDI and the trigger parameters). Every parameter is described in the parameter reference.
Controls that have no effect with the current settings are dimmed (for example Trace Length (Free) while Sync is Tempo). Double-click a knob to reset it to its default.
Status bar
A progress bar through the current segment, then the trace length, the host tempo and bar, the longest trace a memory slot can hold, and counts of evictions and merges. In Rolling cue mode it shows how far behind the live cue is. Messages from imports, saves and presets appear here for a few seconds.